Action Scheduler Check
Monitor critical Action Scheduler errors with filtering by error type, hook, and date range.
The Check page surfaces critical errors from your WordPress site's Action Scheduler — failed executions, timeouts, and fatal errors. The page has two columns: the Error Log Details table on the left and filter controls on the right.
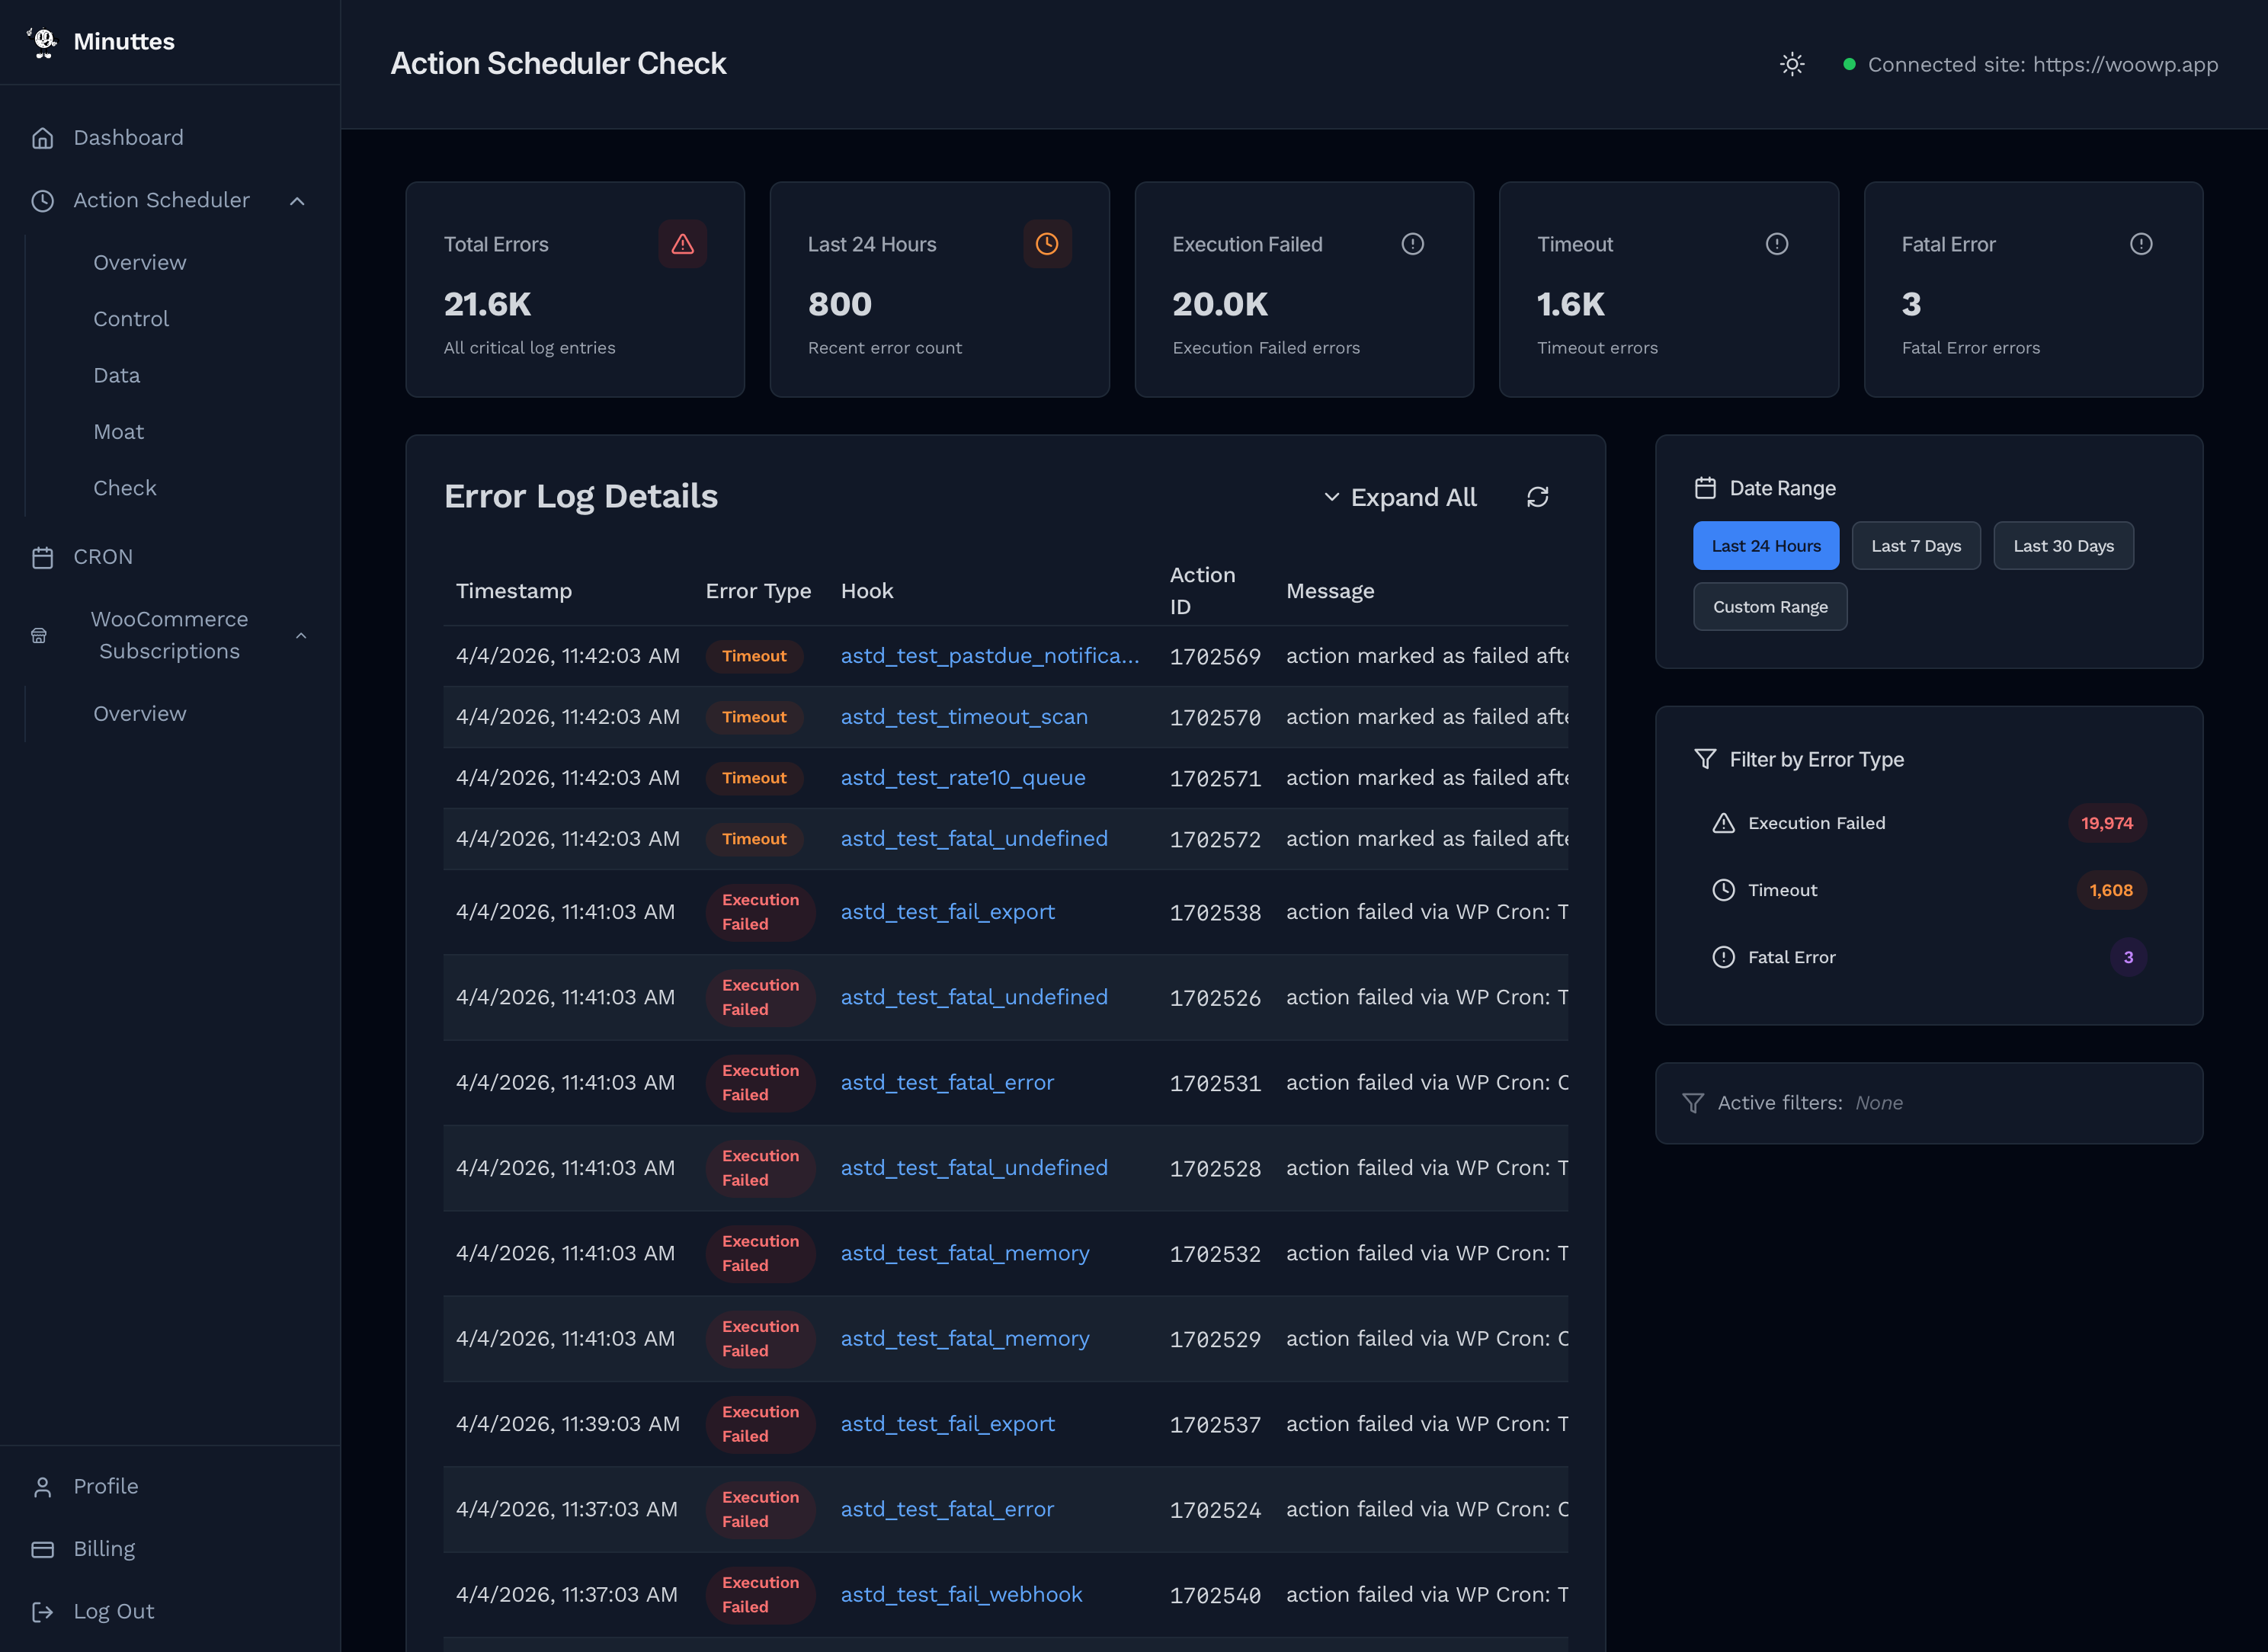
Summary Cards (1)
Five cards (1) at the top summarize the current error state.
| Card | What It Shows |
|---|---|
| Total Errors | All critical log entries captured by the Minuttes logger. |
| Last 24 Hours | Errors recorded in the last 24 hours. |
| Execution Failed | Actions that threw an error during execution. |
| Timeout | Actions that exceeded their allowed execution time. |
| Fatal Error | Actions that caused a PHP fatal error or unexpected shutdown. |
Large numbers are abbreviated automatically (e.g. 5,100 shows as 5.1K).
Error Log Details (2)
The main table (2) lists individual error log entries. Each row is a single critical event captured from your WordPress site.
Columns
- Timestamp — When the error occurred, in your local time format.
- Error Type — Color-coded badge: red for Execution Failed, orange for Timeout, purple for Fatal Error.
- Hook — The Action Scheduler hook that failed (e.g.
woocommerce_deliver_webhook_async). - Action ID — The numeric ID of the failed action in
wp_actionscheduler_actions. - Message — The error message logged by Action Scheduler.
Expanding Messages
Long messages are truncated by default. Click the chevron icon next to a message to expand it. Use Expand All / Collapse All in the table header to toggle all messages at once.
Inline Filtering
Click any Error Type badge or Hook name in the table to instantly filter by that value. The filter appears in the Active Filters bar and the table reloads with matching entries only.
Pagination
The table shows 20 entries per page. Navigation at the bottom includes:
- Entry count (e.g. "Showing 1 to 20 of 87 entries")
- Previous / Next buttons
- Current page indicator (e.g. "Page 2 of 5")
Date Range (3)
The Date Range panel (3) in the sidebar controls which time window the table and summary cards cover. Four presets are available:
- Last 24 Hours (default)
- Last 7 Days
- Last 30 Days
- Custom Range
Changing the date range reloads both the summary cards and the log table.
Custom Range
Select Custom Range to show date pickers for From and To. Enter dates manually or use the browser's native date picker.
Error Type Filter (4)
The Error Type Filter panel (4) shows three buttons, one per error category:
- Execution Failed — Actions that threw an error.
- Timeout — Actions that timed out during processing.
- Fatal Error — Actions that caused a PHP fatal error or unexpected shutdown.
Each button shows the count of matching errors. Click a button to filter the table to that error type only. Click again to deselect. Only one error type filter can be active at a time.
Active Filters (5)
The Active Filters bar (5) at the bottom of the sidebar shows all currently applied filters as removable badges:
- Error type — e.g. "Error: Execution Failed"
- Hook — e.g. "Hook: wc_gla_cron_daily_notes"
Click the X on any badge to remove that filter, or click Clear All to reset all filters at once. Date range is not shown here — it is managed separately in the Date Range panel.
How Errors Are Captured
The Minuttes plugin replaces the default Action Scheduler logger with a custom logger that intercepts log() calls. When Action Scheduler logs a message, the plugin checks it against a set of known error patterns. If a match is found, the entry is written to a dedicated log file (via WooCommerce logger or a standalone JSON file).
Only messages matching these patterns are captured — routine messages like "action started" or "action complete" are ignored. This keeps the log focused on actionable errors.
Error Types
| Type | Triggered By |
|---|---|
| Execution Failed | Messages containing "action failed" — the action ran but threw an error. |
| Timeout | Messages containing "marked as failed", "timeout", or "timed out" — the action exceeded its time limit. |
| Fatal Error | Messages containing "unexpected shutdown" or "PHP Fatal error" — a crash during execution. |
Additional patterns are detected for less common error types (database errors, deadlocks, claim failures). These appear in the log table but are not broken out into dedicated summary cards.
FAQ
Why does the page show zero errors when my site has failed actions?
The Minuttes logger only captures errors going forward from when the plugin was installed. Failed actions that occurred before installation exist in the standard wp_actionscheduler_logs table but are not imported into the Minuttes log files. If you see failed actions in WooCommerce > Status > Action Scheduler but zero errors here, those failures predate the plugin.
What is the difference between Check and Overview?
Overview tracks aggregate counts (scheduled, completed, failed, etc.) over time. Check shows the actual error messages — what went wrong, which hook, and when. Use Overview for trends and Check for diagnosing specific failures.
Can I filter by hook name?
Yes. Click any hook name in the log table to filter by it. The hook filter appears as a badge in Active Filters and can be removed with the X icon or Clear All.
How far back can I search?
Use the Date Range presets (24 hours, 7 days, 30 days) or select Custom Range for any arbitrary period. The available data depends on how long the Minuttes plugin has been active and how log retention is configured on your WordPress site.
What does "Execution Failed" mean vs "Fatal Error"?
Execution Failed means the action ran but encountered an error (e.g. an API call returned an error response). Fatal Error means PHP itself crashed during execution (e.g. out of memory, undefined function). Fatal errors are more severe and may indicate server-level issues.