Action Scheduler Control
Real-time queue monitoring, activity tracking, and administrative controls for Action Scheduler.
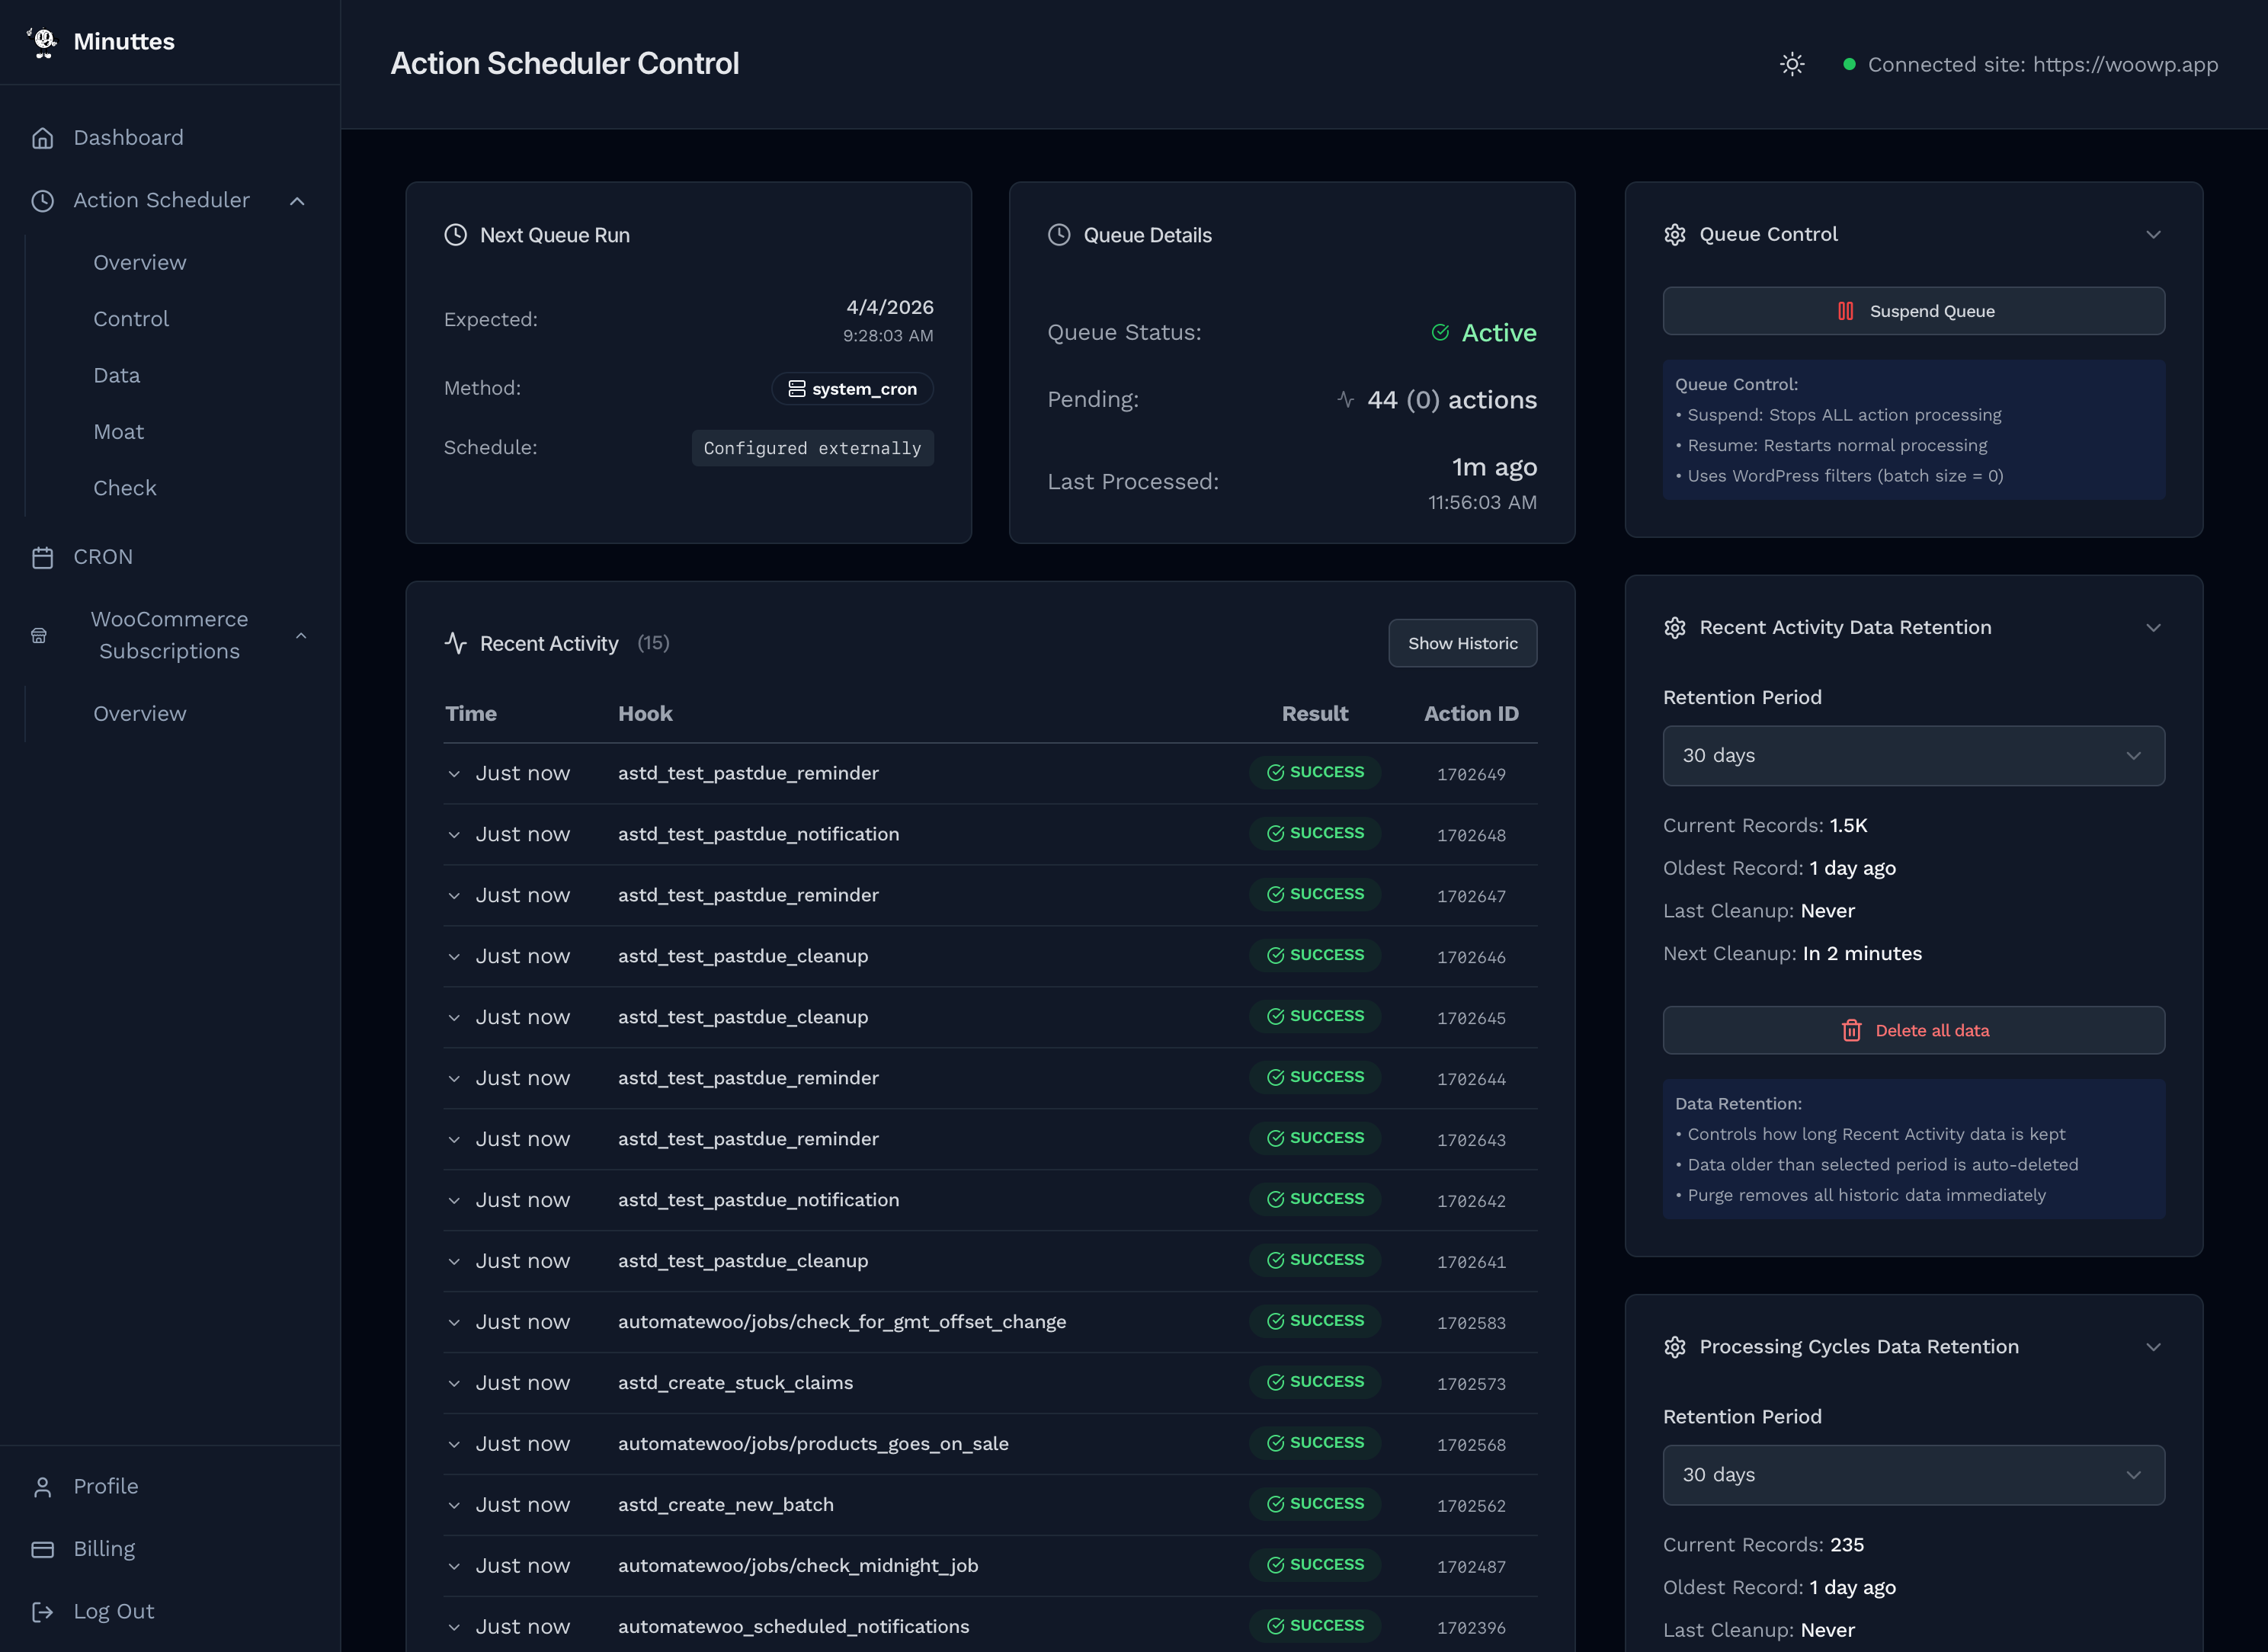
The Control page gives you a live view of your Action Scheduler queue. It auto-refreshes every 10 seconds, showing what the queue is doing right now — which hooks are running, whether cycles are completing, and if anything is failing. The right sidebar provides administrative controls for suspending the queue, managing data retention, and detecting version conflicts.
Next Queue Run (1)
The top-left card (1) shows when Action Scheduler will next process the queue.
| Field | What It Shows |
|---|---|
| Expected | Date and time of the next scheduled queue run. |
| Method | How the queue is being triggered (e.g. wp_cron). Shown as a badge. |
| Schedule | The cron expression or interval governing queue runs, displayed in monospace. |
If no scheduling data is available (e.g. the site hasn't been connected yet), the card displays a placeholder message.
Queue Details (2)
The top-right card (2) shows the current health of the queue at a glance.
| Field | What It Shows |
|---|---|
| Queue Status | Active (green check), Suspended (orange pause), or Unknown (gray clock). |
| Pending | Total pending actions, with past-due count in parentheses. Past-due is highlighted in orange when non-zero. |
| Last Processed | Relative time since the queue last processed an action (e.g. “7m ago”), plus the full timestamp. |
Recent Activity (3)
The main content area (3) shows a live feed of individual action releases — each hook that Action Scheduler picked up and executed. The card has two modes: Recent (default) and Historic, toggled via the button in the card header.
Recent Mode
Displays the 15 most recent releases as they happen, updating every 10 seconds with the page auto-refresh.
| Column | Description |
|---|---|
| Time | Relative time (e.g. “7m ago”). Click to expand the row for full details. |
| Hook | The action hook name. Long names are truncated with a tooltip on hover. |
| Result | Color-coded badge: SUCCESS (green), FAILED (red), or TIMEOUT (orange). |
| Action ID | The Action Scheduler action ID, shown in monospace. |
Historic Mode
Click Show Historic to switch to the searchable, paginated history view.

Historic mode adds three filters at the top of the table:
- Search — Type a hook name to filter results.
- Result — Filter by All Results, Success, Failed, or Timeout.
- Time Range — Last Hour, Last 6 Hours, Last 24 Hours (default), Last 7 Days, or Last 30 Days.
A statistics summary appears below the filters showing the total releases and success rate for the selected time range. Pagination controls at the bottom let you move through results page by page.
Expanded Rows
Click any row in the activity table to expand it and see full execution details:
- Full Hook Name — The complete, untruncated hook name.
- Error Message — If the action failed, the error is shown on a red background.
- Claimed At — When Action Scheduler claimed the action for processing.
- Released At — When the action completed or was released.
- Worker Info — Process ID (PID) and hostname of the worker that executed the action.
Processing Cycles
Below Recent Activity, the Processing Cycles card shows queue batch runs — each time Action Scheduler wakes up and processes a group of actions. Like Recent Activity, it has both Recent and Historic modes.

| Column | Description |
|---|---|
| Time | When the cycle ran (relative time). |
| Actions | Number of actions processed in this cycle (e.g. “2 actions”), or “Empty cycle” if none. |
| Success | Count of actions that completed successfully (green). |
| Failed | Count of actions that failed (red). |
| Status | Cycle status badge: COMPLETED, FAILED, or RUNNING. |
In Recent mode, summary statistics appear below the table: total cycles, empty cycles, active cycles, average actions per cycle, and success rate. A status message like “Processing normally” appears when the success rate is 95% or above.
Historic mode adds Status and Time Range filters, plus a statistics summary showing total cycles, completion rate, and overall success rate.
Queue Control (4)
The Queue Control panel (4) in the right sidebar lets you suspend and resume the Action Scheduler queue. This is the primary emergency control for stopping all action processing on your site.
Suspending the Queue
- Click Suspend Queue (red button)
- A confirmation dialog appears explaining that all action processing will stop
- Enter a reason for the suspension — this is logged for audit purposes
- Confirm to suspend
Suspension works by setting the Action Scheduler batch size to 0 via WordPress filters. This stops all processing immediately. The Queue Details card will update to show “Suspended” with an orange pause icon.
Resuming the Queue
- Click Resume Queue (green button, shown when suspended)
- The dialog shows the current pending and past-due action counts so you know what will start processing
- Confirm to resume — processing restarts immediately
An info section at the bottom of the panel explains the mechanics: suspend stops all processing, resume restarts it, and both use WordPress filters (batch size = 0 for suspend).
Data Retention (5, 6)
Two separate retention panels (5, 6) control how long historical data is kept — one for Recent Activity and one for Processing Cycles. Both work the same way.
- Retention Period — Select how many days to keep data (e.g. 30 days). Data older than the selected period is automatically deleted.
- Current Records — Total entries stored.
- Oldest Record — Date of the earliest entry.
- Last Cleanup — When the automatic cleanup last ran.
- Next Cleanup — Countdown to the next scheduled cleanup.
- Delete all data — Immediately purge all historic data. A confirmation dialog prevents accidental deletion.
Cleanups happen automatically in the background. The retention period applies independently to each data type, so you can keep activity data longer than cycle data (or vice versa) depending on your needs.
Conflict Detection
The Conflict Detection panel scans your WordPress site for multiple copies of Action Scheduler bundled by different plugins. Version conflicts can cause unexpected behavior or fatal errors.
| Status | Meaning |
|---|---|
| Clear (green) | No conflicts detected. Only one version of Action Scheduler is present or all copies resolve correctly. |
| Conflict (orange) | Multiple plugins bundle different versions of Action Scheduler. The newer version usually wins, but mismatches can cause subtle issues. |
| Critical (red) | Expected Action Scheduler functions are missing. This typically causes fatal errors for guest users and needs immediate attention. |
The panel always shows:
- Loaded Version — The active Action Scheduler version number.
- Source Plugin — Which plugin is providing the loaded version.
- Copies count — How many copies were found, shown as a badge.
- Scanned — How long ago the last scan ran.
Click the refresh button to re-scan at any time. Expand All copies to see every detected copy with its plugin name and version number.
In a Conflict state, the offending plugin is highlighted in an orange box. In a Critical state, each missing function is listed in a red box so you know exactly what to investigate.
FAQ
What does suspending the queue actually do?
It sets the Action Scheduler batch size to 0 using a WordPress filter. This prevents Action Scheduler from claiming any new actions during its next run. Actions already in progress will finish, but no new ones will start. It does not delete or cancel any pending actions — they remain in the queue and will process when you resume.
How is Recent Activity different from the Overview page?
The Overview page tracks aggregate counts (how many actions are in each status over time). The Control page tracks individual releases — each time Action Scheduler picks up and runs a specific hook. Use the Overview for trends and the Control page for real-time debugging.
Why do I see "Empty cycle" in Processing Cycles?
An empty cycle means Action Scheduler woke up to process the queue but found no actions to run. This is normal on low-traffic sites or when the queue is healthy and keeping up. Frequent empty cycles just mean the scheduler is checking regularly.
Should I be concerned about a Conflict status?
An orange Conflict status means multiple plugins include their own copy of Action Scheduler. WordPress loads the newest version and ignores older copies, which usually works fine. However, if the older plugin relies on deprecated APIs, it can cause issues. Check which plugins are involved and ensure they're all up to date.
What does Critical mean in Conflict Detection?
Critical means expected Action Scheduler functions are missing entirely. This often causes fatal PHP errors, especially for guest users who don't trigger WordPress admin autoloading. The missing functions are listed in the panel — investigate the source plugin immediately and consider deactivating or updating it.
How long should I keep activity and cycle data?
30 days is a good default for most sites. If you're actively debugging queue issues, keep data longer for historical comparison. For stable sites with high throughput, shorter retention (7–14 days) keeps the database leaner without losing useful diagnostic data.