Dashboard
A single screen showing the health of your Action Scheduler queue, WooCommerce subscriptions, and active restrictions.
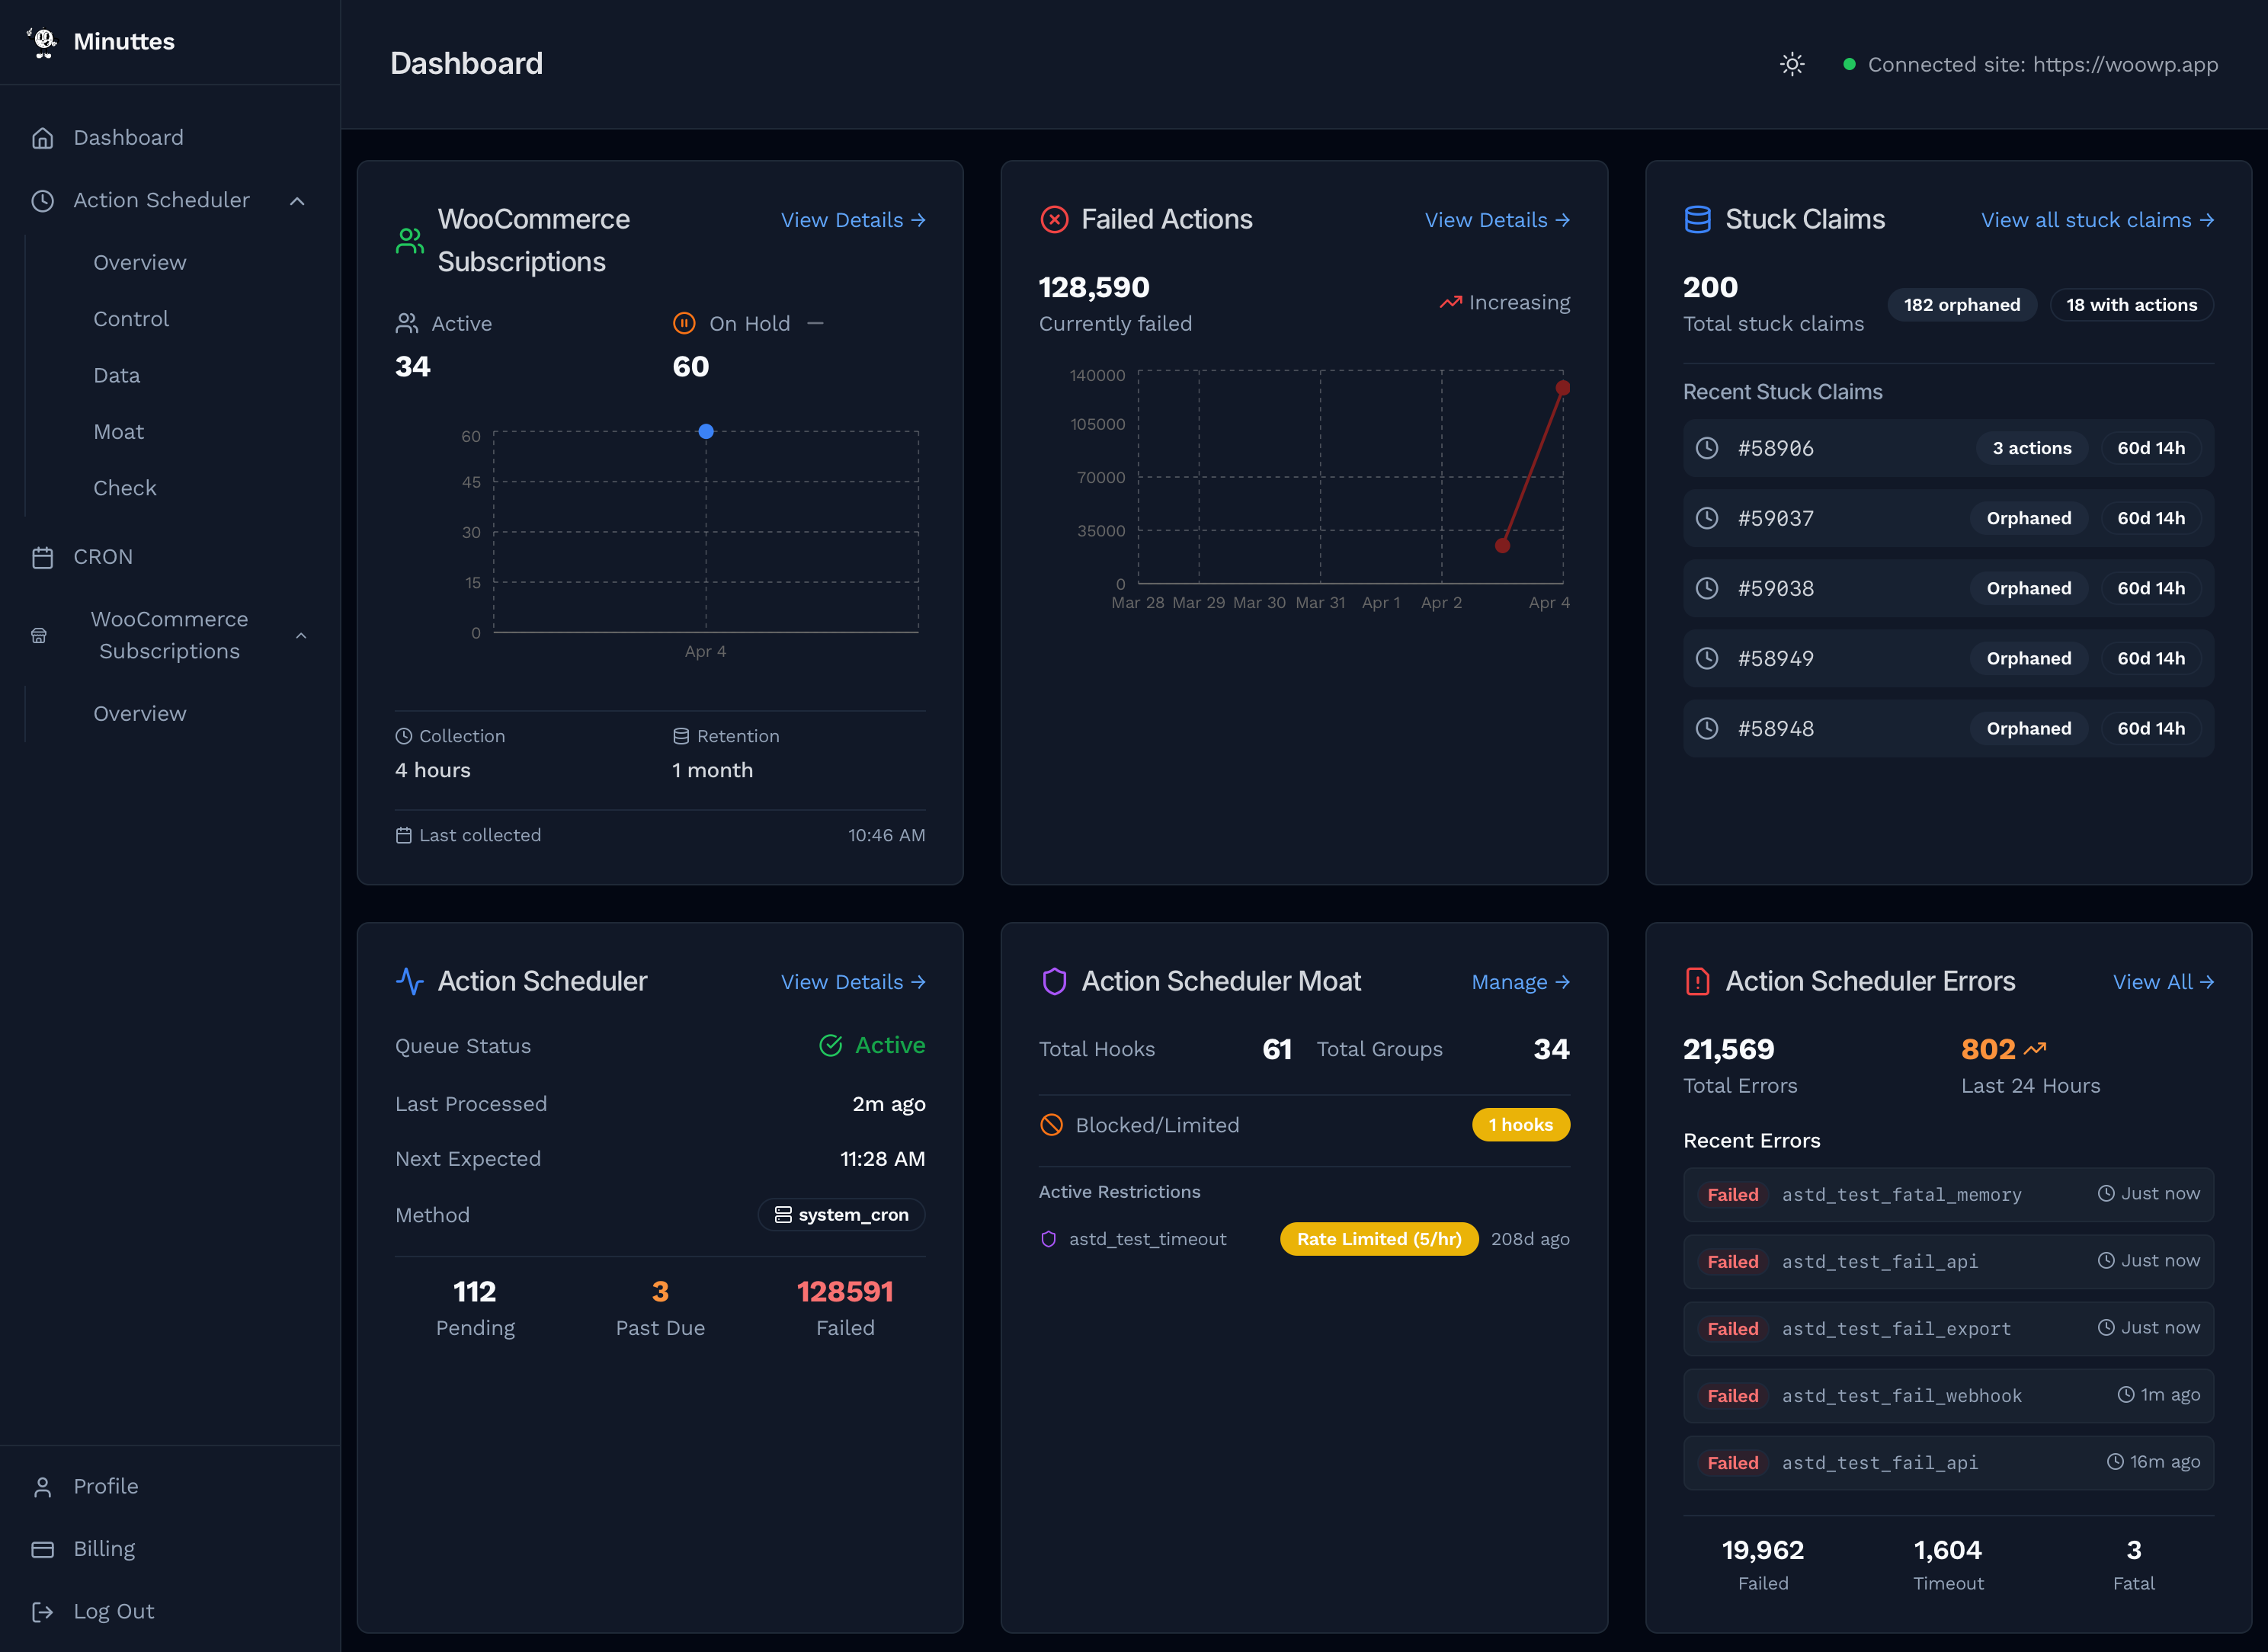
The dashboard displays six widgets in a responsive grid (three columns on wide screens, two on medium, one on mobile). Each widget fetches data from your connected WordPress site and links to its dedicated detail page.
WooCommerce Subscriptions (1)
Shows the current state of WooCommerce subscriptions on your site. Requires the WooCommerce Subscriptions plugin.
| Field | Description |
|---|---|
| Active | Number of active subscriptions. |
| On Hold | Number of on-hold subscriptions with a trend indicator (↑ increasing, ↓ decreasing, — stable). |
| Collection | How often Minuttes snapshots your subscription counts. |
| Retention | How long historical data is kept. |
| Last collected | Timestamp of the most recent snapshot. |
On-Hold Chart
A line chart tracks on-hold subscription counts over time. Useful for spotting payment failures or seasonal patterns. The chart appears once enough snapshots have been collected.
Collection & Retention
The footer shows two settings: the collection interval (how often counts are recorded) and the retention period (how long they're kept). Both are configurable from the WooCommerce Subscriptions detail page.
Failed Actions (2)
Tracks the total number of failed actions in your Action Scheduler queue and how the count changes over time.
- Current count — Total failed actions right now.
- Trend indicator — Arrow showing whether failures are increasing or decreasing compared to the previous snapshot.
- History chart — Red line chart of failure counts over time. Spikes indicate bursts of errors worth investigating.
Click View Details to open the Action Scheduler Overview page with full counts, time-range filters, and deletion tools.
Stuck Claims (3)
A claim is a lock that Action Scheduler places on actions while processing them. If the PHP process crashes or times out, the claim remains and blocks those actions from being retried.
- Total count — Number of stuck claims detected.
- Orphaned — Claims with no associated actions (safe to clear).
- With actions — Claims still attached to pending actions (clearing releases them for retry).
The widget lists the five most recent stuck claims with their ID, type, and age. Click View all stuck claims to open the Action Scheduler Data page where you can clear them individually or in bulk.
Action Scheduler (4)
Real-time status of the Action Scheduler queue. This widget auto-refreshes every 30 seconds.
| Field | Description |
|---|---|
| Queue Status | Green Active, orange Suspended, or gray Unknown. |
| Last Processed | Relative time since the queue last picked up an action (e.g. “2m ago”). |
| Next Expected | When the queue is next scheduled to run. |
| Method | How the queue is triggered (e.g. system_cron). |
| Pending | Total actions waiting to be processed. |
| Past Due | Overdue actions (orange). A growing count indicates the queue is falling behind. |
| Failed | Actions that threw an error (red). |
Click View Details to open Action Scheduler Control for live activity feeds, processing cycles, and queue suspension.
Action Scheduler Moat (5)
Summary of hooks and groups registered in the Action Scheduler queue, and any active blocking or rate-limiting rules.
| Field | Description |
|---|---|
| Total Hooks | Number of distinct hook names in the queue. |
| Total Groups | Number of Action Scheduler groups. |
| Blocked/Limited | Badges showing how many hooks and groups have active restrictions. “None” in green if no rules are set. |
| Active Restrictions | List of currently restricted items with their rule type: red Blocked or orange Rate Limited (N/hr). |
Click Manage to open the Action Scheduler Moat page where you apply, modify, or remove restrictions.
Action Scheduler Errors (6)
Captures critical errors from the Action Scheduler log. This widget auto-refreshes every 60 seconds.
| Field | Description |
|---|---|
| Total Errors | All-time count of captured errors. |
| Last 24 Hours | Recent error count. Orange with a trend icon when greater than zero. |
| Recent Errors | Up to five recent log entries, each showing error type, hook name, and time. |
Error types are colour-coded: red Failed (execution error), orange Timeout (exceeded time limit), purple Fatal (PHP fatal error or unexpected shutdown).
Click View All to open Action Scheduler Check for filtering by type, hook, and date range.
Auto-Refresh
Three of the six widgets refresh automatically in the background:
| Widget | Interval |
|---|---|
| Action Scheduler | Every 30 seconds |
| Action Scheduler Moat | Every 60 seconds |
| Action Scheduler Errors | Every 60 seconds |
WooCommerce Subscriptions, Failed Actions, and Stuck Claims load once when the page opens. Reload the page to refresh them.
FAQ
Why do some widgets show “No site connected”?
You need to connect a WordPress site first. See the Getting Started guide.
Why is the WooCommerce Subscriptions widget disabled?
Your site does not have the WooCommerce Subscriptions plugin active. The widget shows placeholder values (“—”) until the plugin is detected.
What does Past Due mean?
Actions scheduled in the past that the queue hasn't processed yet. A small count is normal during busy periods. A count that keeps growing means the queue is falling behind — check the queue status and processing cycles on the Control page.
How do I clear stuck claims from the dashboard?
The dashboard shows a summary only. Click View all stuck claims to go to the Data page where you can clear them individually or set up automatic cleanup.
Can I rearrange or hide widgets?
Not currently. The dashboard has a fixed layout optimised for the most common monitoring workflow.